Customer Lifetime Value (CLV): How to Measure and Increase It

Customer lifetime value (CLV) estimates how much financial value a customer brings to a business over the course of the relationship. It can reflect the business impact of customer satisfaction and loyalty, but it does not measure either one directly. Companies typically use metrics such as Customer Satisfaction Score (CSAT) and Net Promoter Score (NPS) to evaluate those areas of the customer experience. In this article, we'll explain why CLV matters, what influences it, how to calculate it, and what businesses can do to increase it.
The Strategic Importance of Customer Lifetime Value
CLV represents the total revenue or gross profit a business earns from a customer throughout the relationship. It can be calculated in two main ways. Historical CLV looks at completed purchases and past customer behavior, while predictive CLV uses available data to estimate how much value a customer may generate in the future.
Calculating CLV can help a business understand the financial impact of customer retention. It also makes it easier to identify high-value customers, find opportunities to strengthen long-term relationships, and spot segments that may be at risk of churning.
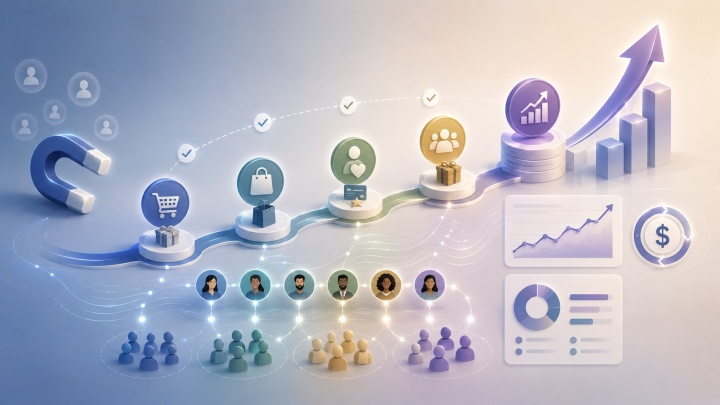
CLV can support decisions about customer retention, segmentation, resource allocation, and the overall customer experience. Here are some of the main ways businesses can use it.
Increase profits through effective customer retention
Research cited by Harvard Business Review suggests that acquiring a new customer can cost five to 25 times more than retaining an existing one, although the difference varies by industry. Bain & Company has also reported that a 5% improvement in customer retention may increase profits by 25% to 95%. These figures are useful benchmarks, but the actual impact depends on the company's margins, customer behavior, and business model. CLV data can help businesses decide how much to invest in acquisition and how much to allocate to retention initiatives such as loyalty and re-engagement campaigns.
Improved segmentation and personalization
CLV makes it easier to segment customers according to the value they bring to the business. High-value segments may justify more personalized service, stronger retention efforts, or early access to new products. The same analysis can reveal inactive or lower-value customers who may respond to a well-timed offer, a better onboarding experience, or a relevant re-engagement campaign.
Accurate budgeting and resource allocation
Without reliable data on customer value, a business may spend too much or too little on acquisition. CLV provides a clearer picture of how much the company can reasonably afford to invest in attracting different customer segments. Comparing CLV with customer acquisition cost, or CAC, can also show whether the current acquisition strategy is financially sustainable.
Customer experience optimization
CLV analysis can help a company see where changes to the customer experience are most likely to have a financial impact. Depending on the data, this may mean improving onboarding, customer support, after-sales service, or community programs.
A better experience can encourage repeat purchases, referrals, and longer customer relationships. Over time, these changes may increase the revenue or gross profit generated by each customer.
Measuring CLV: Key Formulas and Calculation Methods
Calculating CLV helps a business understand the value customers have generated so far and estimate what they may generate in the future. There is no single formula that works for every company. The right method depends on the business model, purchasing patterns, available data, and whether the company wants to measure revenue or gross profit.
Standard CLV formula
One simple way to estimate customer lifetime value is:
CLV = Average Order Value × Purchase Frequency × Average Customer Lifespan
Average order value is the amount customers typically spend per order:
AOV = Total Revenue ÷ Total Number of Orders
Purchase frequency shows how often the average customer buys from the company:
Purchase Frequency = Total Number of Orders ÷ Number of Unique Customers
Average customer lifespan is the typical length of time a customer continues buying from the business.
Suppose a customer spends an average of $60 per order, makes four purchases per year, and remains active for three years. The estimated CLV would be:
$60 × 4 × 3 = $720
This formula works well as a basic estimate when purchasing patterns are fairly consistent. However, it does not account for gross margin, changes in customer behavior, differences between cohorts, or the time value of money.
CLV calculation formula for subscription business models
Subscription businesses often estimate lifetime value using average revenue per user and customer churn:
LTV = ARPU ÷ Customer Churn Rate
ARPU (Average Revenue Per User) is calculated for a specific period:
ARPU = Revenue During the Period ÷ Number of Active Users During the Same Period
Customer churn rate is the percentage of customers who leave during a defined period:
Customer Churn Rate = Customers Lost During the Period ÷ Customers at the Start of the Period × 100
ARPU and churn must cover the same time frame. Monthly ARPU, for example, should be paired with monthly churn. The churn rate must also be written as a decimal when it is entered into the LTV formula. A churn rate of 5% becomes 0.05.
If monthly ARPU is $50 and monthly churn is 5%, the estimated revenue-based LTV is:
$50 ÷ 0.05 = $1,000
A company can adjust the formula to reflect gross profit rather than revenue:
Margin-Adjusted LTV = ARPU × Gross Margin Percentage ÷ Customer Churn Rate
With an ARPU of $50, a gross margin of 70%, and monthly churn of 5%, the calculation would be:
$50 × 0.70 ÷ 0.05 = $700
These formulas are useful for quick estimates, but they assume that revenue, margins, and churn remain relatively stable. Businesses with seasonal demand, frequent price changes, expansion revenue, or widely different customer segments may need a more detailed model.
Cohort approach
Cohort analysis groups customers according to a shared starting point, such as the month of their first purchase. The business can then compare retention, repeat purchases, and revenue across different acquisition periods.
Retention for a particular cohort can be calculated as follows:
Cohort Retention Rate = Active Customers During the Period ÷ Original Cohort Size × 100
For example, if a cohort begins with 100 customers and 60 are still active one month later, its one-month retention rate is 60%.
Retention alone does not equal CLV. To measure how much value a cohort has generated so far, divide its cumulative revenue by the number of customers who originally joined it:
Historical Cohort Value to Date = Cumulative Cohort Revenue ÷ Original Cohort Size
If a cohort of 100 customers generates $30,000 during its first year, its average historical value is:
$30,000 ÷ 100 = $300 per customer
That figure reflects the value generated to date, not the customers' full lifetime value. A predictive cohort model must also estimate future retention, spending, and, where relevant, gross profit.
Calculating Net Customer Value and the CLV-to-CAC Ratio
CLV and customer acquisition cost are separate metrics. CLV measures the value generated by a customer, while CAC measures how much the business spent to acquire that customer.
Subtracting CAC from a margin-adjusted CLV estimate provides a simple view of customer value after acquisition costs:
Net Customer Value = Margin-Adjusted CLV − CAC
This calculation should not be treated as another CLV formula. It is better understood as a basic measure of whether the value generated by the customer justifies the acquisition expense.
CAC is calculated as follows:
CAC = Total Sales and Marketing Costs ÷ Number of New Customers Acquired
Both figures should cover the same reporting period. Depending on the company's accounting approach, acquisition costs may include advertising, sales commissions, salaries, marketing software, automation tools, agency fees, and other related expenses.
Companies can also compare the two metrics directly:
CLV-to-CAC Ratio = CLV ÷ CAC
The result shows how much customer value the business generates for every dollar spent on acquisition. For profitability analysis, businesses should generally use a margin-adjusted CLV and apply the same calculation method consistently over time.
Core Drivers of CLV and Customer Profitability
CLV, also known as lifetime value or LTV, depends on how much a customer spends, how long the relationship lasts, and how much it costs the business to serve that customer. The main drivers fall into several groups: revenue, retention, customer experience, costs, product characteristics, and market conditions.
Revenue drivers:
- Purchase frequency. Customers who buy more often generally generate more revenue over the course of the relationship, which can raise CLV.
- Average order value. A higher AOV can increase CLV when purchase frequency, customer lifespan, and other factors remain stable. Businesses may raise AOV through upselling, cross-selling, product bundles, or pricing changes.
- Customer lifespan. The longer customers continue buying from the company, the greater their potential lifetime value.
- Margin per customer. A revenue-based CLV calculation shows how much money a customer spends, while a margin-adjusted calculation provides a clearer view of how much value the relationship creates after direct costs.
Churn and retention drivers:
- Churn rate. When more customers leave, the average customer relationship becomes shorter and expected CLV usually falls. Reducing churn can extend customer lifespan and increase the value generated over time.
- Engagement and product usage. Customers who regularly use a product are often more likely to renew or make another purchase. For SaaS and subscription businesses, changes in usage may also provide an early warning that a customer is likely to churn.
Drivers of customer experience and loyalty:
- Customer satisfaction. A positive experience can support stronger retention and repeat purchasing, although the effect on CLV will vary by customer and business model.
- Loyalty and brand connection. Loyal customers may buy more often, remain with the business longer, and recommend the brand to others. However, these patterns should be confirmed with the company's own customer data rather than assumed.
Cost drivers:
- Customer acquisition cost. A high CAC can weaken unit economics unless the business generates enough gross profit from each customer to recover the acquisition expense.
- Variable operating costs. A business with relatively low costs to serve each additional customer may achieve a stronger margin-adjusted CLV. However, SaaS companies do not automatically have better customer-level margins than product businesses. Infrastructure, support, sales, and service costs still matter.
Product and market drivers:
- Product differentiation. A product that is difficult to replace may support stronger retention and give the business more pricing flexibility. The effect depends on whether customers see the difference as valuable.
- Market maturity. In some established markets, switching costs or customer habits may support retention. In others, mature competition can limit pricing power and make it harder to increase CLV.
- Competition. Intense competition can put pressure on prices, retention, and profitability, especially when customers can switch providers easily.
Strategies to Increase CLV and Improve Unit Economics
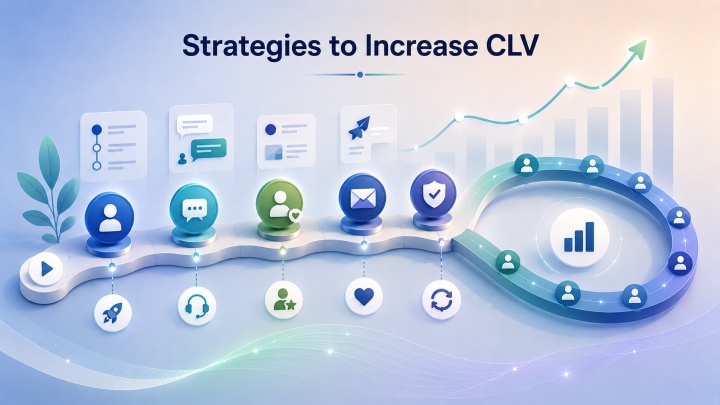
Increasing CLV usually involves helping customers get more value from the relationship while giving them good reasons to stay. The most effective approach will depend on the business, but common priorities include order value, purchase frequency, retention, customer experience, and marketing efficiency.
Increasing AOV
Increasing the amount customers spend per order can raise CLV, provided it does not reduce purchase frequency or retention. Unlike acquiring a completely new customer, generating a larger order from an existing customer does not require paying the original acquisition cost again. However, promotions, financing options, and sales campaigns may still carry additional costs.
Common ways to raise AOV include upselling, cross-selling, product bundles, add-ons, volume discounts, and premium product options.
Reducing CAC
Lowering customer acquisition costs can improve unit economics even when revenue remains unchanged. It may shorten the CAC payback period and increase the amount of customer value left after acquisition expenses. However, reducing CAC does not increase CLV itself. The two metrics measure different parts of the customer relationship.
SaaS businesses often use an LTV-to-CAC ratio of around 3:1 as a general benchmark. In practical terms, this means the estimated lifetime value of a customer is three times the cost of acquiring that customer.
Still, 3:1 is not a universal target. A suitable ratio depends on gross margin, growth stage, cash flow, customer retention, and the time required to recover acquisition costs. A ratio well above 3:1 may suggest that the company has room to invest more in growth, but it does not automatically mean the business is underinvesting.
Businesses can lower CAC by improving organic acquisition, developing referral programs, investing in content and SEO, using product-led growth, and building effective partner or reseller channels.
Improving customer experience
A poor customer experience can shorten customer relationships and reduce repeat purchasing. Since both factors affect CLV, businesses should look for points of friction that make it harder for customers to buy, use the product, or get help.
Possible improvements include clearer onboarding, more useful personalization, responsive support, simpler customer journeys, transparent pricing, and reliable delivery. The right priorities will depend on what customers value and where they currently encounter problems.
Increasing customer retention rates
Customer retention is one of the main factors behind lifetime value. Customers who stay longer have more opportunities to make repeat purchases or continue paying for a subscription.
Better retention does not reduce the original cost of acquiring a customer. Instead, it allows the business to earn more revenue or gross profit from that initial investment, which can improve both the LTV-to-CAC ratio and the CAC payback period.
Effective retention strategies may include clear onboarding, useful educational resources, proactive support, customer health monitoring, and timely check-ins. Businesses can also use support channels, chatbots, and knowledge bases to make it easier for customers to solve problems, although automation should not replace human support when an issue requires personal attention.
It is also worth identifying customers whose activity or engagement has declined. A timely conversation, relevant offer, or practical solution may prevent churn or bring an inactive customer back.
Conclusion
Customer lifetime value is especially useful for businesses that depend on repeat purchases, subscriptions, or long-term customer relationships. It helps teams understand which customers and segments create the most value and where additional investment may produce the strongest return.
Predictive CLV models can support decisions involving acquisition, retention, segmentation, personalization, and resource allocation. However, CLV should not be viewed in isolation. Churn, customer satisfaction, engagement, gross margin, acquisition costs, and retention should still be tracked as separate metrics.
When CLV is calculated consistently and interpreted alongside these measures, marketing and sales teams can make better decisions about where to spend, which customers to prioritize, and how to build more profitable relationships.