6 Project Management Metrics to Track Without Fail for Every Sales Project
It can be challenging to evaluate if a project is a success (or failure) without the appropriate data. Sales project managers need practical methods to monitor the status and progress of their projects and plan around any issues that may arise. Project management metrics help sales managers define the parameters of success. Specifically, performance metrics allow you to evaluate the overall health of your project and identify and mitigate risk factors. They also help you monitor team productivity and overall performance.
The complexity of the project influences which success metrics will use. As a result, some metrics are more relevant than others, depending on the project. For example, a book launch will require a different set of key performance indicators (KPIs) than a SaaS sales campaign. However, the hallmarks of a successful project are generally the same: it delivers on time, stays within budget, achieves its objectives, and meets customer expectations. So, which KPIs for sales project management should you be monitoring?
Actual Cost
The Actual Cost KPI is the first of two baseline metrics in project management discussed in this article. It helps track project progress by showing the total amount of money spent on the project. To calculate Actual Cost, simply add all the expenses incurred over the entire project, from labor to materials.
Assessing the actual cost of your project gives you a comprehensive understanding of your expenditure. It also influences other project variables like the quality and scope of your project.

Let’s say the implementation costs of your new sales acceleration software run over budget. To offset this, you may need to decrease the number of software training days or reduce the scope of your marketing campaigns. Additionally, you need to know your project’s actual cost to calculate other metrics like cost performance.
Cost Performance
The Cost Performance Index (CPI) is a cost efficiency metric that measures how well your project is performing against the budget. Project managers use it to determine if the project is progressing as planned and put corrective measures in place when it falls behind schedule or runs over budget.
To calculate cost performance, divide the Budgeted Cost of Work Performed (also Earned Value) by the Actual Cost of work completed. The result is expressed as a ratio.
CPI = EV/AC
For example, if the budgeted costs for the client presentation stage of the sales process are $5,000 but the actual costs come to $10,000, the cost performance is 0.5. Cost performance values greater than one signal that the project is performing well against the budget. From the example above, the value is less than one; therefore, the project is over budget.
Customer Satisfaction
Customer satisfaction scores use customer feedback to measure the quality of your product or service. Project managers use variables like complaints, revenue generation, customer retention or churn rates to guide this project management metric.
You can get this customer feedback by sending surveys to your customers’ emails directly. It’s important to use an email verification tool before sending the surveys, though. This will help ensure they reach the intended recipients.
A commonly used customer satisfaction metric is the CSAT. You use it to gauge if your business is meeting customers’ expectations. For example, respondents use a scale from one to five, with one meaning very unsatisfied and five meaning very satisfied, to answer a survey question. To calculate the CSAT score, the number of satisfied customers (those who scored 4 and 5), divide by the number of survey respondents, and multiply by 100. So, if the number of satisfied customers is 72 and the number of survey respondents is 150, your customer satisfaction score is 48%. Benchmarks for a good CSAT score vary by industry. However, a score of less than 50% is poor.
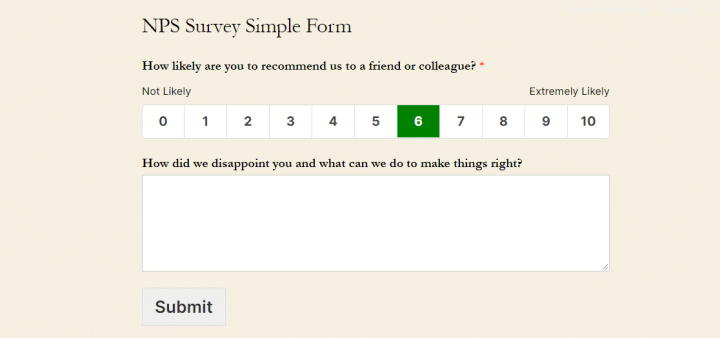
The Net Promoter Score (NPS) is another customer service KPI that measures customer satisfaction. In this case, it measures your customers' loyalty. The NPS is a single-question customer survey that asks respondents how likely they are to recommend your product or service to their peers.
The NPS survey example asks respondents to rate their loyalty on a scale from zero to ten. There are optional follow-up questions where customers explain the reason for the score. Depending on the score, you can customize the follow-up question. Here, the question asks how the business disappointed the customer and how it can improve.

Respondents who answer the survey with six and below are detractors. These are unhappy customers and can damage your brand reputation. A score of seven or eight indicates passive customers. They like your brand but aren’t loyal to it. Promoters, with a score of 9 or 10, are your brand enthusiasts and can contribute to business growth.
The secret to getting good customer satisfaction and NPS scores isn’t really a secret. Just ensure a good customer experience throughout the buyer’s journey. So, you want good customer support and the best web hosting for search engine optimization and great loading speed, for example. This last one is especially critical for eCommerce companies.
Earned Value
Earned Value is the second baseline project management metric of this article. Also known as the Budgeted Cost of Work Performed (BCWP), it provides insight into your project’s performance, i.e., whether it is on schedule and within budget. We touched on it when we calculated the Cost Performance Index.
- Automate the work of an online store or landing
- Empower through integration
- Don't spend money on programmers and integrators
- Save time by automating routine tasks
Earned Value tells you how much value you’ve gained so far based on the actual work done and the project budget you’ve already spent. To calculate Earned Value, multiply the percentage of work completed by the total project budget (or budget at completion) and divide by 100.
EV = (%Work completed x Budget)/100
Let’s say your four-month project has a budget of $100,000, and by the midway point, you have completed 70% of the project tasks. The earned value is $70,000.
To get the most out of the earned value metric, you should compare it to your project’s planned values. Planned Values are cost estimates of scheduled activities. It uses the same formula as earned value, except you multiply the percentage of proposed work by the total budget and divide by 100. The result tells you the value of planned tasks. Using the example above, the planned value at the two-month mark is $50,000. However, with the earned value in the same timespan at $70,000. You are ahead of schedule.
As a baseline metric, earned value is used to calculate other metrics like cost variance, schedule variance, cost performance index, and schedule performance index.
Gross Profit Margin
In sales, it all comes down to the bottom line, and nothing speaks to the success of a business more than profits; you wouldn’t start a business to make a loss. However, if you're only calculating profits, you're not getting the whole picture.
Profit margins are a better indication of business health than calculating actual profits. After all, an increase in revenue in one month doesn’t translate to increased overall profitability. Large profit margins are an indicator of success and business health.
To calculate gross profit margin in percentages, subtract the total cost from the total sales to give you your profits. Divide that by sales, and multiply by 100.
GPM (%) = Profit/Revenue x 100
With one of your project’s objectives to increase business profits, calculating the gross profit margin throughout the project’s life cycle helps you assess whether or not it is profitable. Project management tools with financial tracking can show you this information at a glance.
Productivity
Tracking team productivity enables project leaders to monitor how much work team members get done. It measures the difference between inputs (capital, labor hours) and output (the number of products or sales). The ideal productivity ratio is more output for less input. For instance, completing more sales on fewer labor hours.
To calculate productivity, divide units of output by units of input. Say you want to know how much is getting done in the given period; divide the number of tasks by that time. So, if a team member completes 200 tasks in 40 hours, their labor productivity is five tasks per hour.
An easier way to track productivity is with project management tools. These tools have automatic time and task tracking, giving immediate insight into task completion percentages. Depending on the software you choose, you can even track the budget consumption of each task.
Project management tools allow you to quickly identify underperforming team members or timeline delays and act accordingly. For instance, you could introduce gamification to motivate employees and celebrate project milestones.
In Closing
As sales managers, you’re familiar with the benefits of measurement practices. You use sales KPIs to measure the performance of sales teams. Similarly, project management metrics assess the performance of sales projects to ensure project objectives are met on schedule and within budget.
The specific project performance metrics you choose to track will depend on the size and complexity of the project. However, we shared six key metrics for your sales projects. They included actual cost and earned value, two baseline metrics used to calculate other project KPIs. The other four metrics were cost performance, gross profit margins, productivity, and customer satisfaction.
You can use any number of project management metrics to track your sales project. However, the six discussed here will ensure successful project completion by monitoring timelines, budgets, objectives, and customer expectations.
Apix-Drive is a universal tool that will quickly streamline any workflow, freeing you from routine and possible financial losses. Try ApiX-Drive in action and see how useful it is for you personally. In the meantime, when you are setting up connections between systems, think about where you are investing your free time, because now you will have much more of it.


