Top 10 Flowchart Software in 2022
The Google Drawings program can not be called unsuccessful, because it allows you to solve many graphic tasks. And yet, having discovered some shortcomings, the user begins to look for a more suitable option. Well, everyone has the right to choose what is best for him. And our article, in which we will talk about 10 worthy analogues of this application, will help with this.
Why look for alternatives
Google Drawings is a free application for creating various drawings, posters and serious graphics (diagrams, charts, tables). Included in the Google Docs Editors webpack. You can work in it both independently and together with colleagues or friends online.
What you might not like:
- you need a constant and stable Internet connection (you won’t be able to use offline);
- Mandatory presence of a Google account;
- no open source.
Someone may say that these are not shortcomings, but simply nitpicking of an overly demanding user. But still, if the listed points are important to you, you should pay attention to alternative programs that not only are not inferior, but also surpass Google Drawings in a number of ways.
What is flowchart software
If you are looking for a way to communicate complex concepts in the most intelligible way, to explain hidden relationships, to present ideas in a simple way, you need good visualization. It is convenient in that it allows you to immediately draw attention to the main message, and also clearly demonstrates patterns that are difficult to trace in a text or tabular format.
To create high-quality visualization today there are many tools. Some are extremely simple (you just need to load the data and specify how it is displayed). Others are more complex, requiring serious settings. We have selected 10 options - for every taste and skill level. We invite you to take a look and choose what suits you best.
Draw.io
Cost: free
Compatibility: Web App, Windows, MacOS, Android
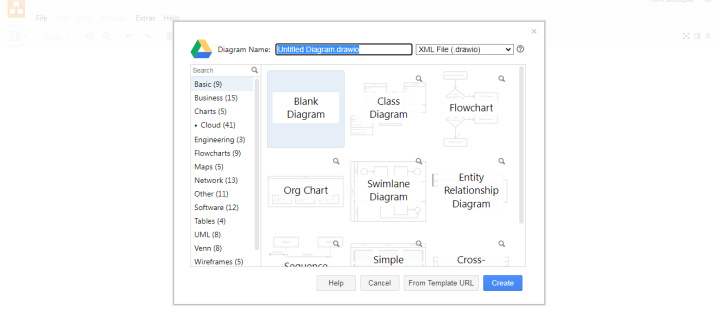
Draw.io is an open source application. With it, you can create graphs, charts, flowcharts, tables, presentations, mind maps, website layouts, sales funnels, floor plans and much more. IT specialists can use the program to draw a web resource, a mobile application, an e-learning course due to the presence of ready-made elements in the database (various buttons, sample menus, drop-down lists). Draw.io provides a large library of web objects, as well as elements from Google and Apple. All this can speed up the development process, inspiring the programmer to create interfaces that meet the requirements of UX and UI.
A distinctive feature of the program is that there is no need to register. At the entrance, you will only need to choose where to save the finished work. Another benefit is easy launch. To open Draw.io, you need to click on the icon of the installed application, use a special plug-in for the Google Chrome browser, or simply go to its website https://app.diagrams.net/ .
Draw.io provides import and export of files in PNG, PDF, HTML, XML, VSDX formats. The finished work can be saved to your computer or mobile device, as well as placed in the cloud - Google Drive, Dropbox, OneDrive, and so on. The tool has integration with Atlassian's Jira and Confluence products. If you need to link this application with other systems, you can do this in Apix-Drive.
Canva
Cost: Free, Pro ($12.99 per month or $119.99 per year for 1-5 users), Enterprise ($30 per month for 1 user)
Compatibility: Web App, Windows, MacOS, Android, iOS
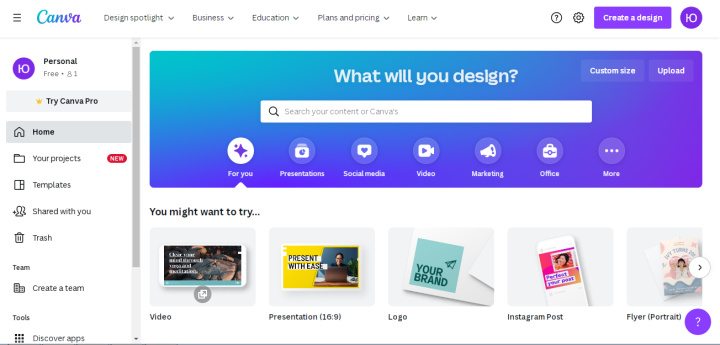
Canva is an online service for creating and publishing quality graphics. With it, you can make beautiful headlines, design websites, personal blogs, groups and pages on social networks, presentations, album and book covers, advertising materials, draw logos. The application is suitable not only for ordinary users, but also for experienced professionals in the field of digital marketing and graphic design.
You can start working with Canva right after signing up. If there is no desire and time to enter personal data, accelerated authorization is provided through an existing account on Google or one of the social networks. The next step is to select a template from an extensive library and switch to the graphics editor environment. Here the user can personalize the selected template, change the background and color, apply filters, add text, music and even video. The result should be a unique graphic product.
During the file saving process, you can choose from 13 commonly used image formats today. Raster, vector, supported by graphic editors and camera RAW are available.
There are 2 ways to export the finished work from the application: download it to the memory of your computer, tablet or phone, or share it on a social network. If necessary, it is possible to immediately send it to the printer for printing.
Microsoft Visio
Cost: free version for a trial period (1 month), paid versions (1st option - $5 per month per user on a subscription, option 2 - $15 per month per user on a subscription; one-time purchase: Standard 2021 - 309.99 $719.99 Professional 2021)
Compatibility: Web App, Windows
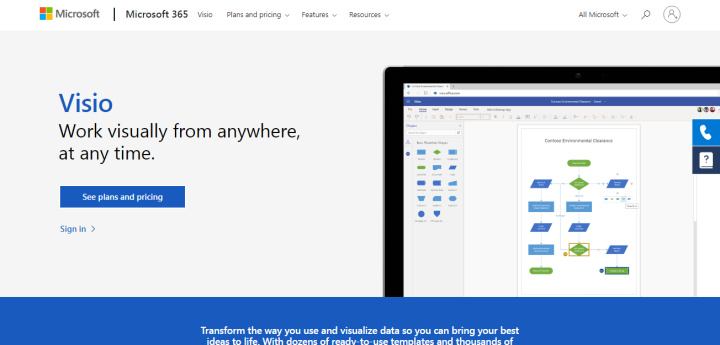
Microsoft Visio is an editor for working with vector graphics. Designed and available in 3 editions: Standard, Professional and Pro for Office 365.
Microsoft Visio helps you effectively accomplish these tasks: present information in a graphical format, analyze complex data, and share it with other users. An impressive library of various layouts and templates allows you to depict almost any structure, and numerous arrows - to link its blocks together.
Visio's primary means of expressing data is vector shapes, which act as building blocks for a diagram, plan, or diagram. They are located in the task area of the same name. For the convenience of the user, they are all grouped into thematic categories. To add the desired shape to the project, you just need to drag it to the workspace. Then you can start editing its dimensions, properties, and display options. In addition to shapes, you can also use other graphic elements, text and numbers, and color formatting.
The application supports the ability to collaborate on a project online. This helps to quickly make adjustments and thus increases productivity.
For most users, Visio is an auxiliary program. They work in it in parallel with Access, Excel, SQL Server and other Microsoft services with which it is integrated.
Xmind
Cost: Free, Paid ($39.99 for 6 months or $59.99 for a year; Students and Educators $34.99 for a year; Non-Profit, Community and Government Organizations for $41.99 for a year)
Compatibility: Windows, MacOS, Linux, iPadOS, iOS, Android
XMind is a proprietary program of XMind Ltd. It is usually used to brainstorm and create mind maps more effectively. It helps to express obscure ideas that are difficult to explain in a clear and accessible graphic form. XMind has support not only for mind maps, but also for diagrams of various types: Ishikawa (the so-called cause-and-effect or fishbone diagrams), tree-like, logical, and also tables. This program has proven itself in task and knowledge management, meetings, time management.
No special skills are needed to work with XMind. Thanks to an intuitive interface, even a beginner can master it. Mind maps and fishbone diagrams are drawn by simply pressing the Tab and Enter buttons - this is how new headings and subheadings are created. In diagrams, you can add and change the borders of elements and the relationships between them. Using labels, markers, links, text notes, sound files and images, attaching entire files will help make the diagram more informative.
The program provides an opportunity to work on a project not only alone, but also collectively. Joint activity allows each employee to make a feasible contribution and quickly share the results with members of his team.
The finished project can be downloaded to your computer or mobile device. The saved file will be in xmind format. This suggests that it can only be opened in the XMind and MindMeister programs. If you plan to print a map, chart or table, it is better to choose pdf or one of the Microsoft office programs when saving.
Lucidchart
Cost: Free version, Paid versions (Tariffs: Individual - from $7.95 per user, Team - from $9 per user and Enterprise)
Compatibility: Web App, Windows, Linux, MacOS, Android, iOS
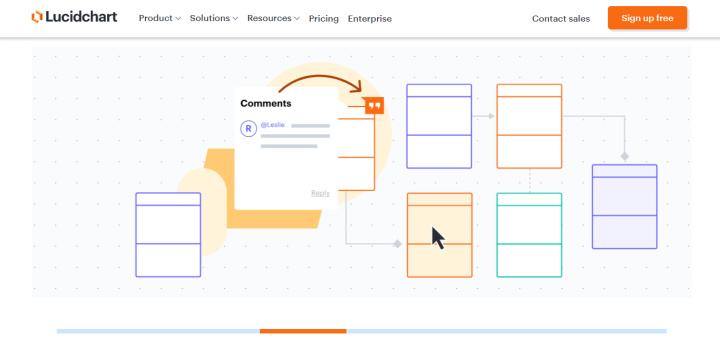
LucidChart is a program from Lucid Software Inc. Purpose - creation and editing of mind maps, flowcharts, diagrams (organizational, UML), site layouts, software prototypes. Most often it is used by art teams, analytics departments, programmers.
The tool allows you to brainstorm, organize ideas and workflows, build diagrams, draw sales funnels, and much more. It helps company management and departmental employees to clearly visualize plans and proposals, making them easier for team members to perceive.
You can create charts and diagrams in Lucidchart using ready-made templates from the program's library, or you can do everything yourself from scratch. It is allowed to connect an unlimited number of users to the simultaneous work on the project. Making any change online triggers instant synchronization - updates are displayed to everyone who has access to the project. The program even has a chat where members of a group or team can exchange comments, agree on corrections and additions. You can export the finished file in PDF, PNG and JPEG formats.
Dia
Cost: free
Compatibility: Windows, Linux, MacOS
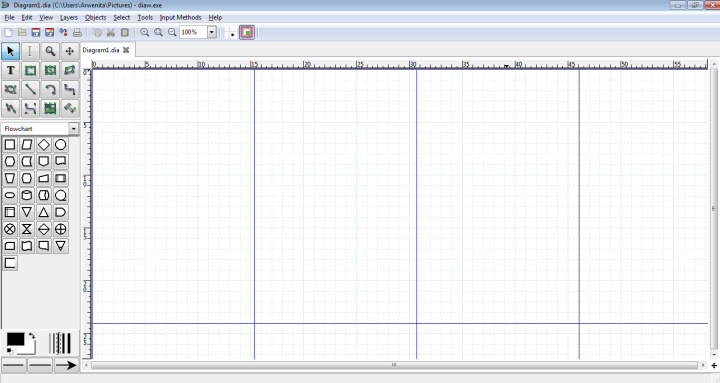
Dia is a free cross-platform program for creating and editing graphics. Included in the GNOME Office package, but can also be used separately from this package. Using the Dia tools, you can make flowcharts of software algorithms, tree diagrams, static UML structures, diagrams (flow, network, ER diagrams), draw elements of radio electronics. Ready-made drawings can be supplemented and illustrated with a presentation, educational material, report, abstract, term paper and diploma work.
The functionality of the diagram editor, if necessary, is extended by installing the appropriate plug-ins from the outside. Thus, you can increase not only the base of tools, but also graphic elements. In addition, the program provides the ability to save already created images inside it, so that later you can use them at any time.
Gliffy
Cost: free version, paid version (after the expiration of the 14-day trial period - from $6 per user per month)
Compatibility: web application
Gliffy is a program for drawing diagrams and flowcharts, drawing graphs, engineering drawings, creating website layouts and interface prototypes, designing floor plans for rooms, as well as graphic modeling (BPMN, UML, UI design, SWOT analysis). To launch the application, you just need to go to the site http://www.gliffy.com .
The Gliffy constructor has a user-friendly interface, offers over 100 shapes and various shapes. To create a diagram, flowchart or any other graphics, you can use ready-made templates from the library or do everything yourself from scratch. One of the significant advantages of the application is integration with Google Drive, JIRA and Confluence.
MindMeister
Cost: Free version, Paid version (from $4.99 per month per user)
Compatibility: Web App, Android, iOS
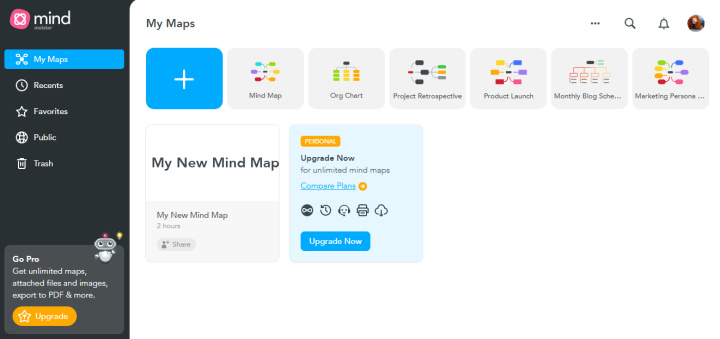
MindMeister is a program for creating so-called mind maps. They make it possible to organize thoughts, help to generate ideas, teach others, and solve tasks more effectively. Clouds and diagrams that people used to draw in a notebook can now be drawn on a computer. In MindMeister, this can be done much faster and more aesthetically.
The application provides the user with the following options:
- Distribution of the finished mind map in social networks and via e-mail.
- Save file as PDF (paid version only).
- Collaborate on a project online.
- Formatting and designing the card without restrictions. The tint palette contains 32 colors for text and background fills. You can place comments, links and emojis inside the clouds. The option to add images is available in the paid version.
- The library contains 60 templates. Each is designed for a specific task.
- Autosave. Everything you have done will not disappear in an instant due to a computer failure or a power outage.
- Work in the application from a mobile device.
- You can draw mind maps even without the Internet. When the network connection is restored, the data will be saved in the program.
- There is integration with Google Drive, Evernote, Dropbox, Twitter.
A significant advantage of MindMeister is that the program does not need to be installed on a computer. To enter, you just need to open a bookmark saved in your browser or enter the website address https://www.mindmeister.com. You must first register or log in with Google or Facebook.
TimeGraphics
Cost: Free version, paid version (from $4.9 per day with a subscription)
Compatibility: web application
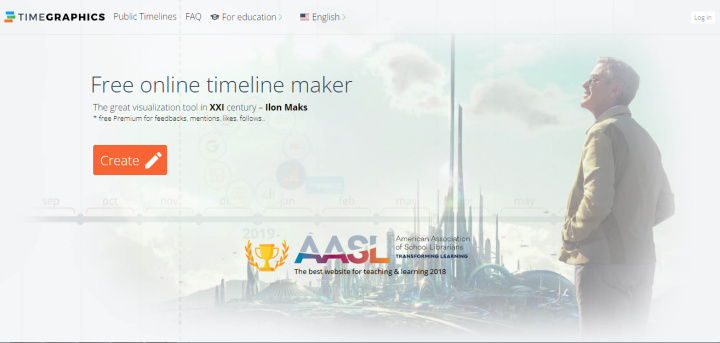
TimeGraphics is a time visualization program. Thanks to it, you can visually and easily present information that was previously extracted bit by bit from books and long reports. The application is designed to facilitate the study of any processes that took place in the past, are happening in the present and are planned in the future. It is used in various fields:
- Education. Using the timeline, you can display historical events. This format enables comparison, comparison and analysis. With TimeGraphics, students will be able to look at history in a new way: discover those cause-and-effect relationships that were previously invisible, track the development of a state or an entire civilization.
- Business. The timeline simplifies planning, allows you to more effectively analyze the potential of the enterprise and make forecasts.
- Personal. The timeline is needed to track personal results and achievements (for example, in sports or self-development). Such graphical visualization clearly shows at what stage you are now, at what speed you are moving and how much is left to reach your destination. The landmark you created will help you detect deviations from the intended path in time. By the way, on the tape you can set new goals and plan events.
The TimeGraphics interface looks like a timeline without end. On it, users can select the desired segments and add titles, graphics, pictures, photos and videos to them, attach files. The finished project can be shared if desired - it will "hang" in a public gallery.
Coggle
Cost: free version, paid version (from $5 per user per month or from $50 per year)
Compatibility: web application
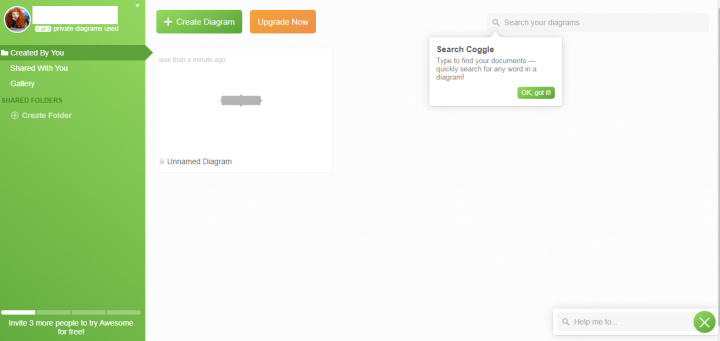
Coggle is a mind mapping software. It will help members of a group or team to brainstorm, inspire the generation of new ideas, and simplify planning for further actions. For non-brainstormers, it is useful for structuring business and personal notes. The application will be appreciated by representatives of creative professions, developers, specialists in the field of advertising and marketing.
You can draw a mind map not only on your own, but also together with employees or friends. The project collaboration option allows for collaborative editing, commenting and internal chat.
On the free version, you can make as many public cards as you like, but for individual use, you can only create three copies. You can download the finished map to your computer or mobile device in PDF format or as a photo. To share it with others, you just need to use the link to it. Embedding on the site is available by entering the code into the page.
Summing up
When asked which alternative to Google Drawings is better, it is impossible to give an unambiguous answer and single out any one program. The fact is that one person needs to make engineering drawings, another needs to develop software interfaces, a third needs to draw some diagrams for term paper, a fourth needs to develop a mind map for brainstorming in the company's marketing department. Each of them will present its own requirements for the software, and they, of course, will differ.
When choosing the best alternative to Google Drawings, outline your needs and decide what you expect from the program. Be sure to consider whether the functionality and capabilities of the free version are enough for you, whether you can allocate funds for the paid one. The best option should satisfy all your wishes at a minimum cost.
Apix-Drive is a simple and efficient system connector that will help you automate routine tasks and optimize business processes. You can save time and money, direct these resources to more important purposes. Test ApiX-Drive and make sure that this tool will relieve your employees and after 5 minutes of settings your business will start working faster.
